What swing trading is
A stock's price doesn't travel in a straight line. It rises for a while, pauses, falls back a little, then carries on. Swing trading is built on that rhythm: it tries to capture the moves between one turning point and the next.
The method behind Swing Traders Corner is W.D. Gann's swing charts, as amended by Marc Rivalland. This course explains it in eight short pages, so the nightly signals make sense when you see them.
What a swing is
A swing is the stretch of price movement between two turning points: from a low up to the next high, or from a high down to the next low. Some swings last a few days. The larger ones last several weeks. Inside a large swing there are usually smaller ones, the pauses and pullbacks along the way.
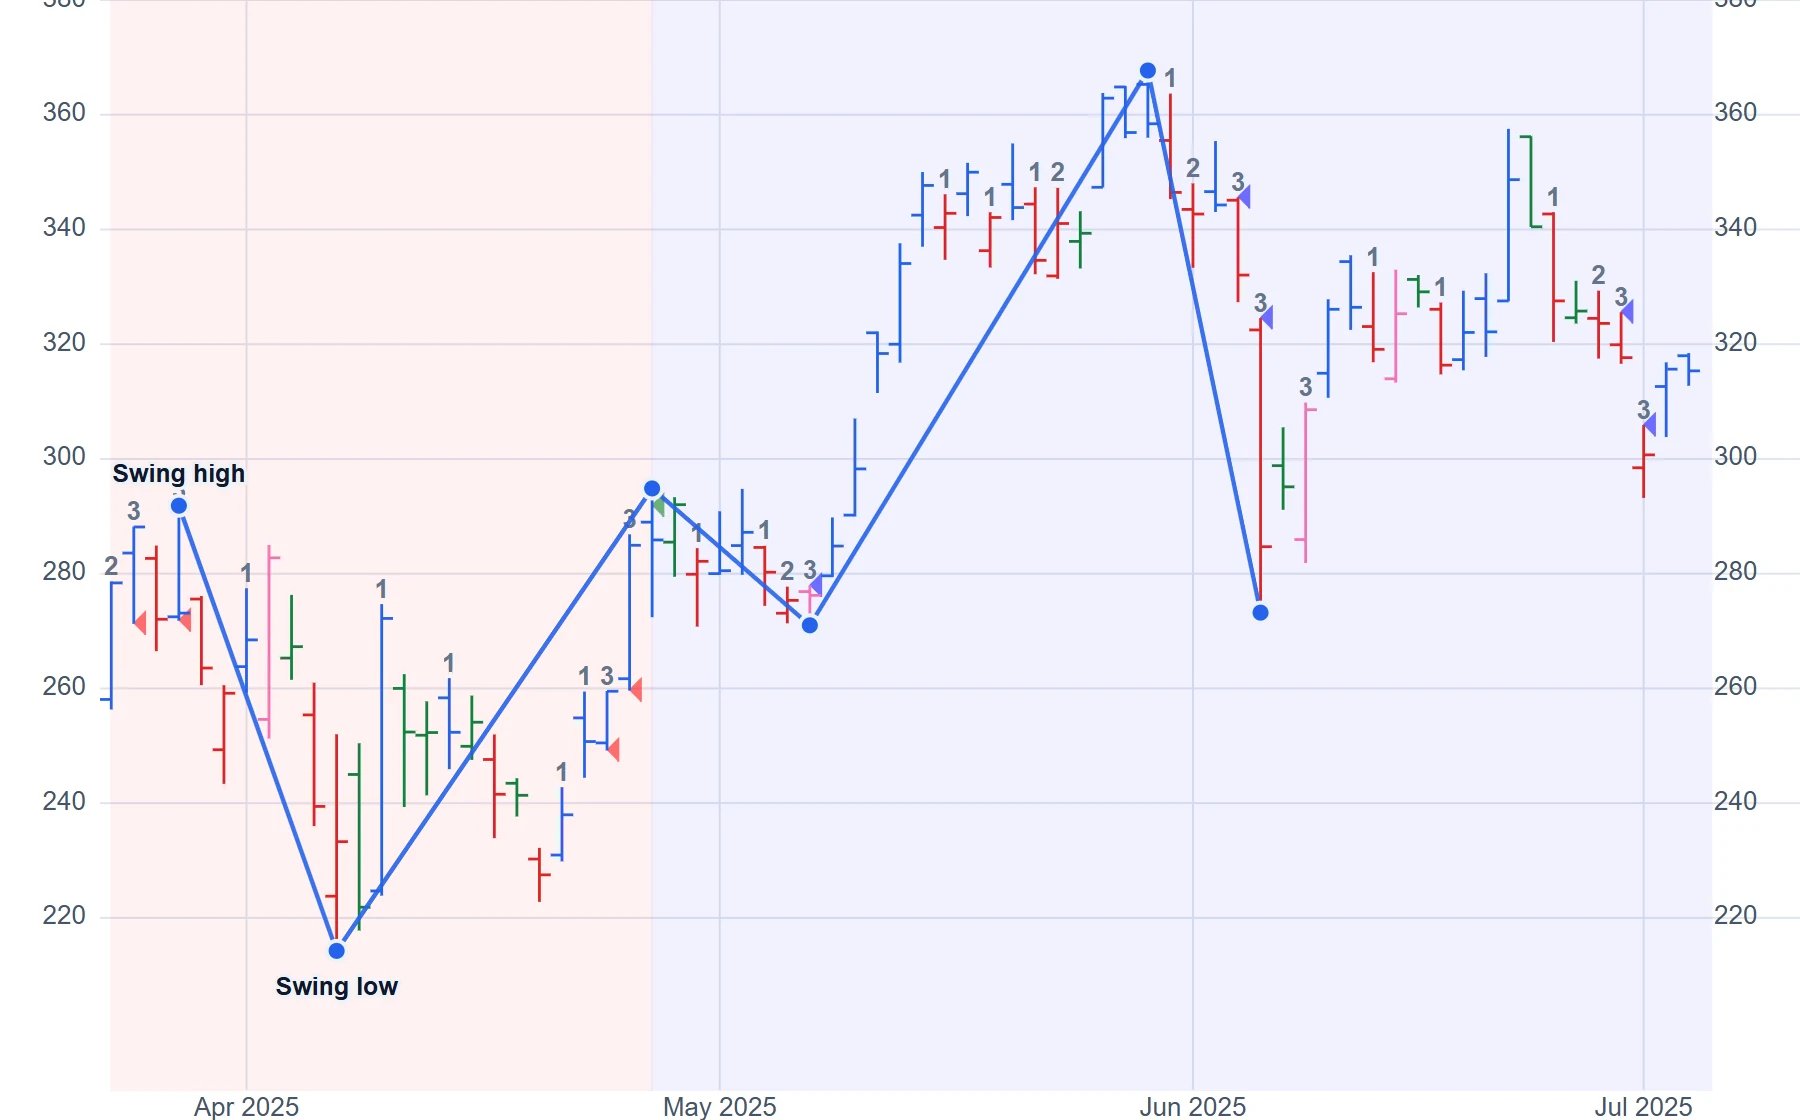
A swing trade aims to take part in one of those moves. It doesn't try to catch the very bottom or the very top. It waits for the market to show that a move has started, and then takes a position in that direction.
How it differs from other approaches
Day trading opens and closes positions within a single session. It needs constant attention and intraday data. A swing trade is held for days or weeks, and it's judged on daily bars, so the whole method can run from an end-of-day signal list.
Buying and holding accepts whatever the market does, on the view that a good company's price will recover from any setback. Swing trading takes the opposite view of a move that goes the wrong way: if the market breaks the level that made the trade sensible, the trade is over, and the method looks for the next opportunity, in either direction.
That last point matters. The method works on both sides of the market. In a rising trend it looks to buy pullbacks. In a falling trend it looks to sell rallies. A falling market is a source of signals, not a reason to stay out.
Why rules matter more than predictions
Nothing in this method forecasts where a price will go. The chart is treated as a record of where buyers and sellers have recently held the upper hand, and the method assumes that balance tends to persist until it visibly shifts.
So every step is a rule that can be checked against a price chart:
- how a day is classified (page 2)
- what counts as a turning point, and when the trend has changed (page 3)
- where each entry sits, and where it's proved wrong (pages 4 and 5)
Rules like these leave less room for mood. Two people applying them to the same chart should reach the same answer, and a computer can apply them to every stock each night. That's what the signals do.
What it isn't
Swing trading isn't a way to be right on every trade. Some signals will follow through for weeks, some will go nowhere, and each one is judged only by whether the plan was followed. The aim is steady, repeatable decisions with limited risk on each, not a perfect record.
It isn't a prediction service either. The signals describe what the method detected at the close. They don't say what the market will do next.
And it isn't quick. The method's results come from many trades over time, with a defined risk on each one. Pages 5 to 7 return to that.
Where this course goes
The next page starts at the beginning: how a single day's price range is turned into one of four kinds of bar.
Next: Swing bars.